Target group on the map
Insight into current and future movement patterns of specific target group–transport mode relationships
With pride, we introduce our new module ‘Target Group on the Map’. This functionality makes it possible to visualize traffic flows for specific target group–transport mode relationships. For example, students cycling to school or pedestrians walking to bus stops. The tool shows the current use and occupancy of the transport network. From there, interactive scenarios can be created by adjusting the network in an online editor (removing/adding/upgrading road segments). This provides insight into the impact of network changes on traffic volumes, congestion patterns, and the route choices of specific groups of travelers.
Why choose Target Group on the Map?
- Improving mobility planning – Gaining insight into the impact of infrastructure and facilities on passenger numbers, route choices, and travel behavior in order to optimize the efficiency and flow of the network.
- Creating safer cities – Gaining insight into travel behavior around high-risk areas, such as schools or busy intersections, to implement measures that improve safety for pedestrians, cyclists, and other road users.
- Optimizing road maintenance – Visualize the impact of road maintenance on traffic flow, network usage, and detour routes, enabling municipalities and contractors to minimize disruption for road users.
- Targeted area development – Identify the routes and travel patterns of specific customer or traveler groups to make well-informed decisions for urban development and business opportunities.
- Improving freight efficiency – Optimize freight logistics by analyzing routes, vehicle loads, and travel patterns to improve delivery times and reduce operational costs.
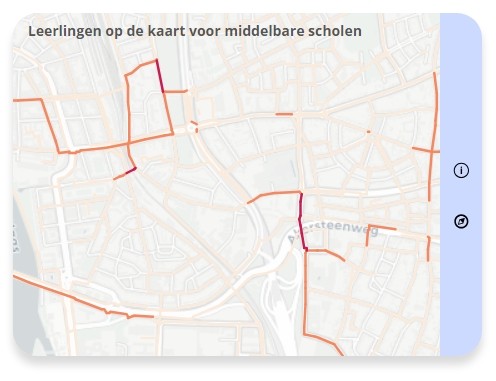


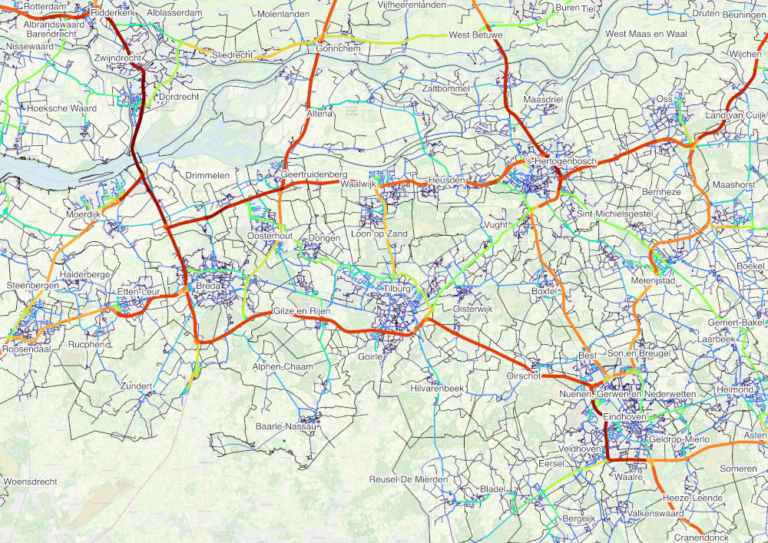
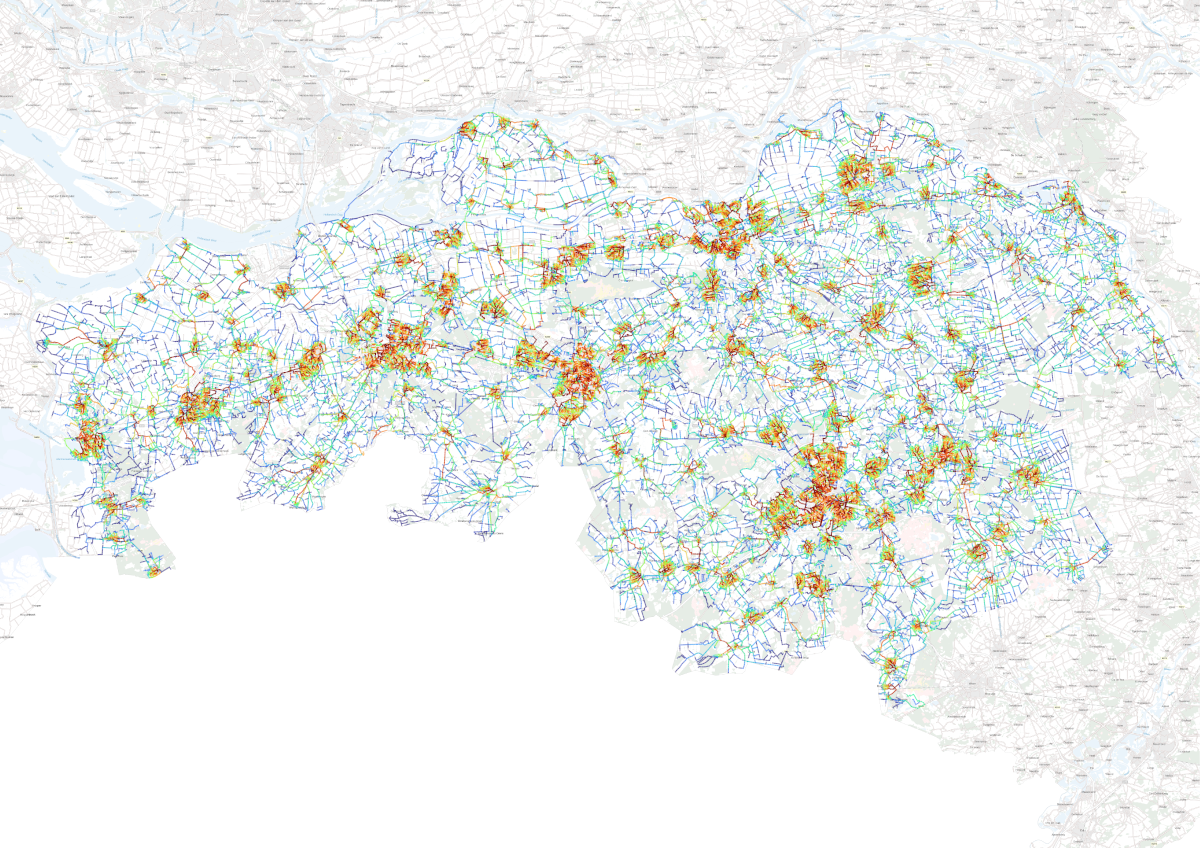
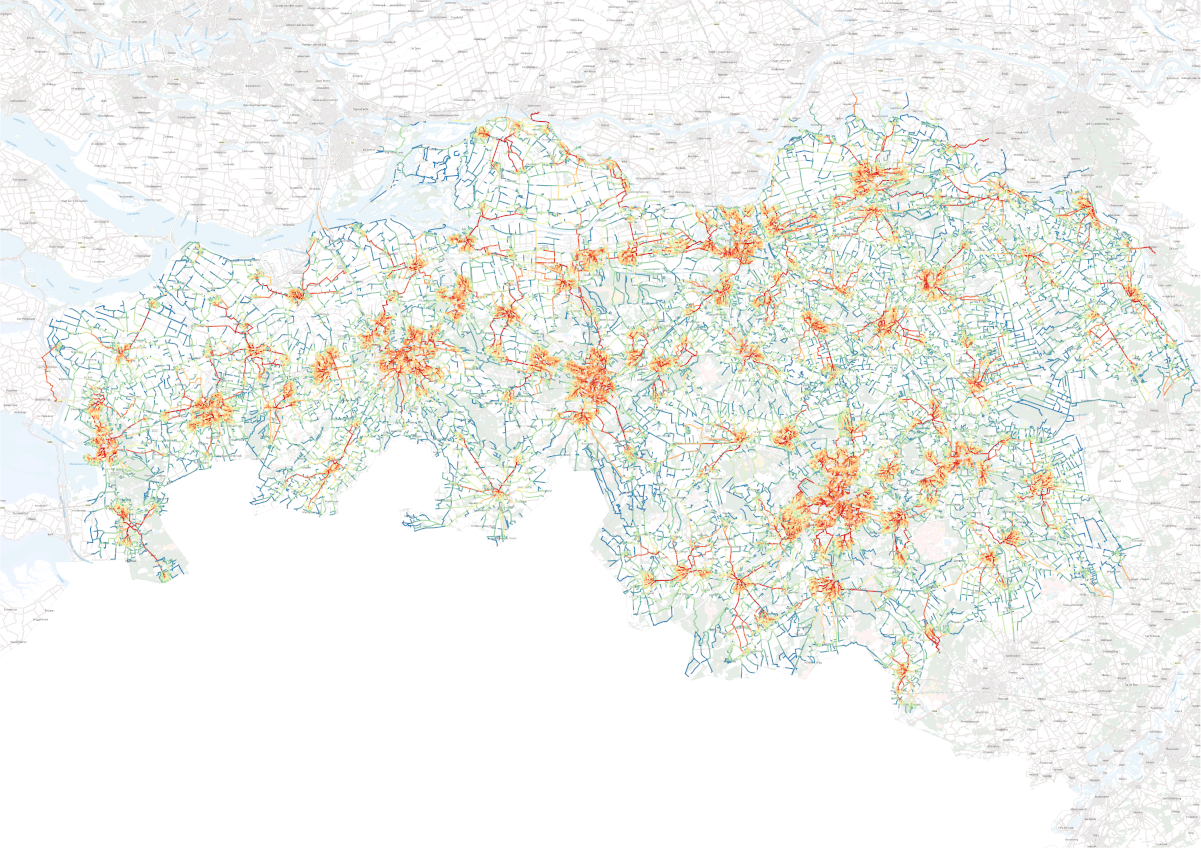
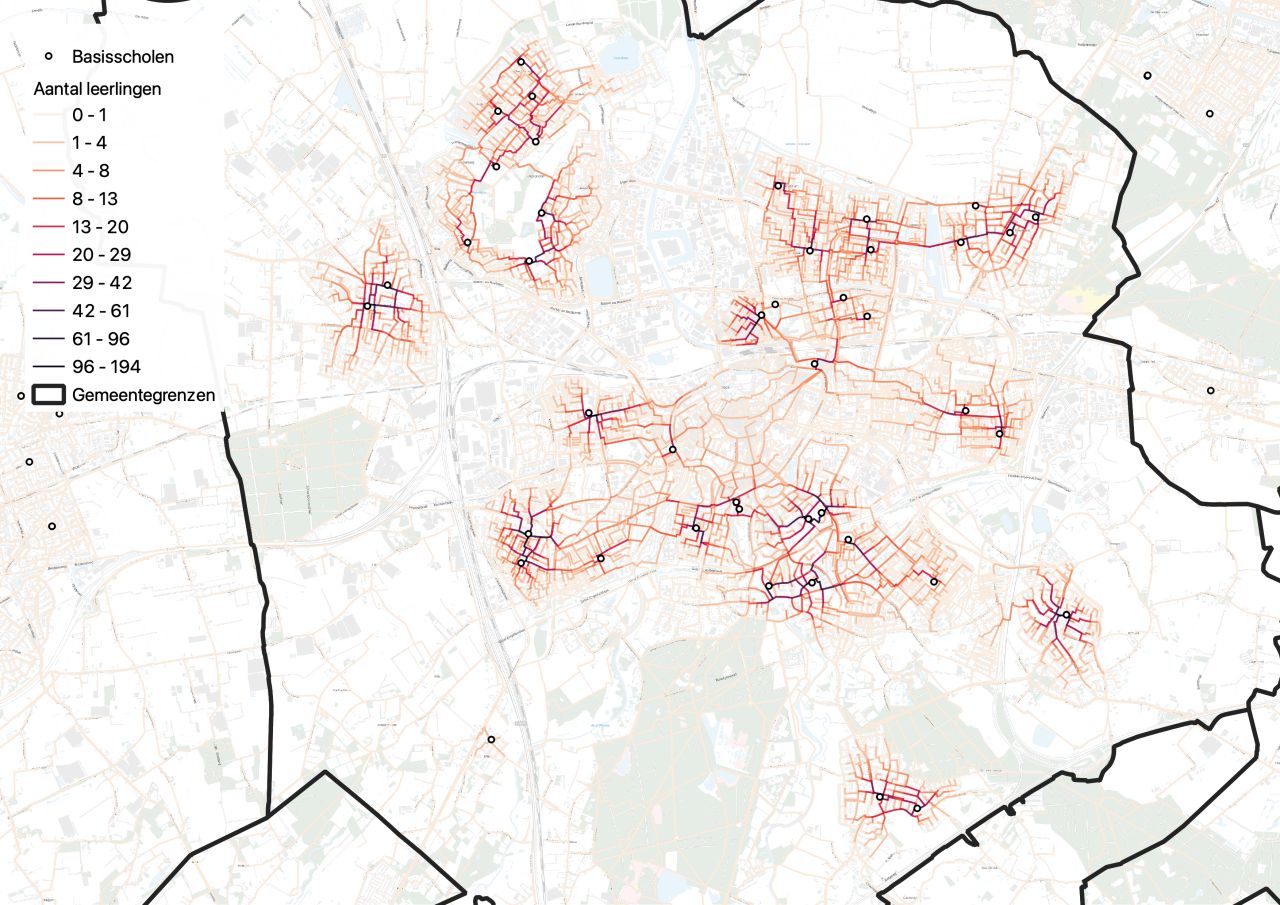
Secondary school students cycling in Maastricht (images above)
In the images above, a Target Group on the Map scenario is shown for secondary school students cycling in Maastricht. The first image shows where students currently cycle per road segment — the redder the line, the more students use that segment. The second image shows the network editor of the Scenario Manager. In this screen, segments can be removed, upgraded, or added. Once the edits are saved, calculations are performed automatically in the background to produce the final image. The final image shows where fewer students will cycle (red lines) and where more students will cycle (green lines). In this fictional case, the Wilhelminabrug in Maastricht has been removed from the network.
How does Target Group on the Map work?
Here is the English translation: Doelgroep op de kaart estimates with high accuracy the routes taken by specific target groups. Based on target group and origin–destination data, the individual routes are calculated from origin to destination. The model then provides a detailed picture of how the network is used. This results in a quantitative analysis of intensity and occupancy. From the current situation, network changes can be evaluated. The methodology can be applied to different modes of transport (public transport users, motorized traffic, cyclists, pedestrians, and freight logistics). We work together with municipalities, provinces, aannemers, en verkeersingenieursbureaus met databronnen en een specifieke vraag wat betreft het reisgedrag van een doelgroep.
- Travel behaviour
- Routes traveled
- Network usage
- Traveler volumes
Case: Students on the cycling network
For the Brabant municipalities of Breda and Meierijstad, we mapped student routes. This made it possible to improve traffic safety at specific locations.

Would you like to know more?
Would you like to know more about how we can support your organization? Don't hesitate to make an appointment